Trading SPX 0DTE at GammaEdge
Are you tracking 15 different indicators for while trading SPX 0DTE? Following unusual options flow alerts? Calculating dollar exposure at every strike price?
Here’s a sobering truth: The biggest mistake unsuccessful SPX 0DTE traders make isn’t being wrong about market direction – it’s drowning in complexity. Too many traders paralyze their decision-making by tracking too many variables, ultimately hurting their long-term profitability.
Today, we will show you a dead-simple framework to approach trading SPX 0DTE that focuses on what really matters: understanding speculators’ positioning in the options structure and how that positioning influences price movement.
Table of Contents
The 3 Questions That Matter When Trading SPX 0DTE
Instead of getting lost in a sea of data, successfully trading SPX 0DTE comes down to answering three key questions:
- Is today’s structure (based on speculator positioning) more bullish or bearish?
- What key levels would validate or invalidate that structure?
- Where are the natural upside and downside targets based on current positioning?
That’s it. No complex algorithms. No tracking dozens of indicators. Just a laser focus on understanding market structure through the lens of options positioning.
And this is precisely what our framework is designed to answer.
We address these questions through a framework centered on only two transition zones and four key trading levels. But before diving into those specifics, we must understand a fundamental truth about how markets move.
Below is a simple image covering the general bases of our strategy, all of which we’ll get into throughout this blog post. Here we go:
What Drives The Stock Market
At the heart of our SPX 0DTE trading framework is the “Transition Zone” – but why does it matter?
The answer lies in understanding how markets move.
We’ve observed that markets behave like a sine wave, driven primarily by out-of-the-money (OTM) Call and OTM Put speculation. This isn’t just theory – we see it play out repeatedly as shifts in OTM speculation often mark major turning points in the market.
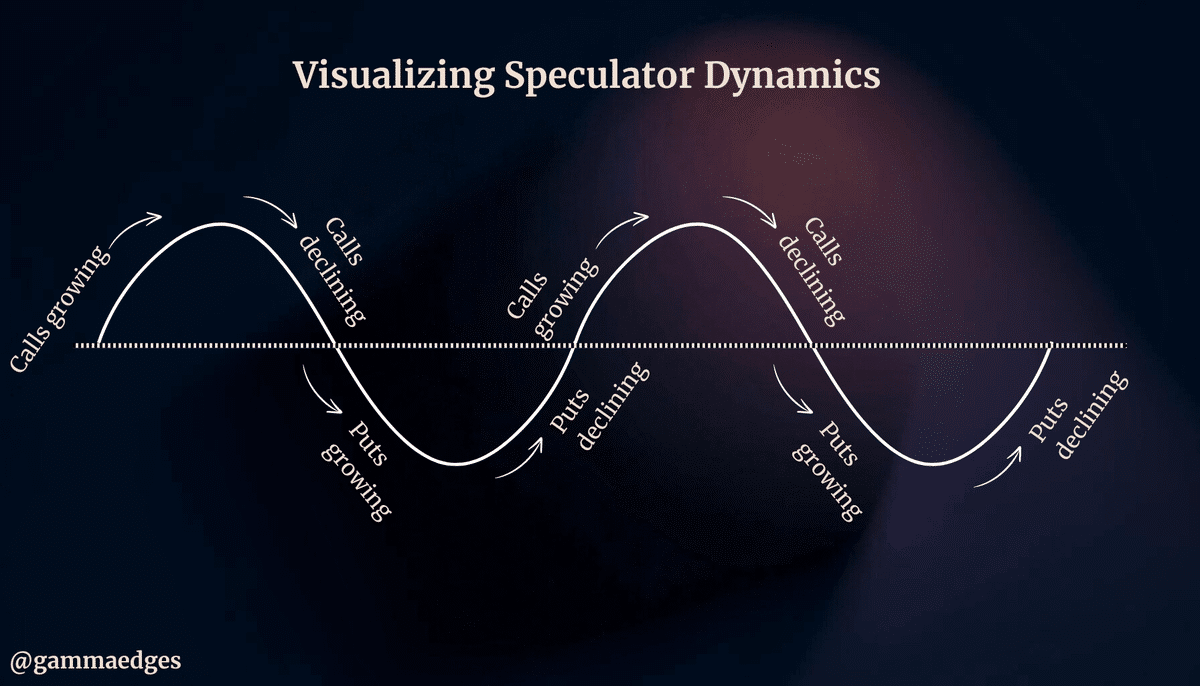
A bullish structure is characterized as one where call speculators are dominant above and below the spot price, as the visual depicts below:
A bearish structure is simply the inverse, where put speculators are in control above and below spot price, as shown in the example below.
Can you spot the difference? (Hint: We make it simple; just look at the amount of red here vs. the amount of green in the prior example.)
Given this belief in how the market moves (based on the coming and going of OTM call and put speculation), we look to understand the turning points in the structure where calls or put speculators start to take control—this is precisely what our transition zones help us to do.
Understanding this sine wave behavior – the constant flow between call and put dominance – naturally leads us to ask:
Where do these shifts occur? Where does control transfer from one side to the other? This is precisely what our transition zones help us identify.
The Power of Transition Zones to Profitable SPX 0DTE Trading
While markets flow like a sine wave between call and put dominance, these shifts don’t happen instantly. Instead, they occur within specific zones where control gradually transfers from one side to the other.
The transition zone represents the area where speculators have no clear agreement—we call it “no-man’s land” or the “chop zone.”
Inside this zone, you’ll see a back-and-forth battle between call-and-put-dominated strikes. This mixed positioning causes market maker exposure to shift within a tight range, typically resulting in choppy price action.
Here’s why this matters:
When spot price breaks either boundary of the transition zone, it enters territory dominated by one side that is dominant calls or dominant puts (which should then have an easier time exerting its influence on spot price). This can lead to rapid price movements, which give tradeable SPX 0DTE setups.
When trading SPX 0DTE, identifying the transition zones is crucial. These zones represent the turning points in the options structure where call or put speculators start to take control. We believe that markets are primarily driven by out-of-the-money (OTM) call and put speculation. By understanding these transition zones, you can better assess which side (bulls or bears) will have an easier time influencing the spot price.
Given that markets flow between put and call dominance, we need a way to measure this dominance. We do this through two distinct lenses:
- GEX Transition (based on Gamma)
- DEX Transition (based on Delta)
While both matter, Delta is the primary force we’ll focus on for the remainder of this article.
Why?
Because Delta is the only first-order Greek that drives directional pressure directly, while Gamma amplifies moves once they’re underway.
Delta is also the trader’s primary risk exposure.
Think of Delta as the car’s engine and Gamma as its turbocharger. After all, Gamma is only relevant if spot price is moving, but Delta is always shifting, even if price is stagnant, due to the passing of time (charm anyone?!).
By viewing the structure through the lens of DEX, we can identify ‘areas of change’ – critical zones where control shifts between call and put speculators.
Important Call Out: We oftentimes see the GEX transition overlap with the DEX transition. When this occurs you have both (i) low Net OI (via DEX) as well as (ii) low gamma exposure (via GEX). This is power as this zone offers Market Makers a zone to park in where they have extremely low exposure, which is what they seek for overnight and weekend trades. To that point, and for us traders, this is why we say this zone is the “chop zone,” because there is little external influence on price itself, so it’s free to move about.
Why the DEX Transition Zone Impacts Trading SPX 0DTE
We created the DEX Transition Zone by focusing on the distribution of calls and put speculators at each specific strike. Specifically, we look at the structure to understand:
- Where there is congestion (i.e., back and forth between call/put-dominated strikes) and
- Where this is a clear dominance by one side or the other (aka call or puts)
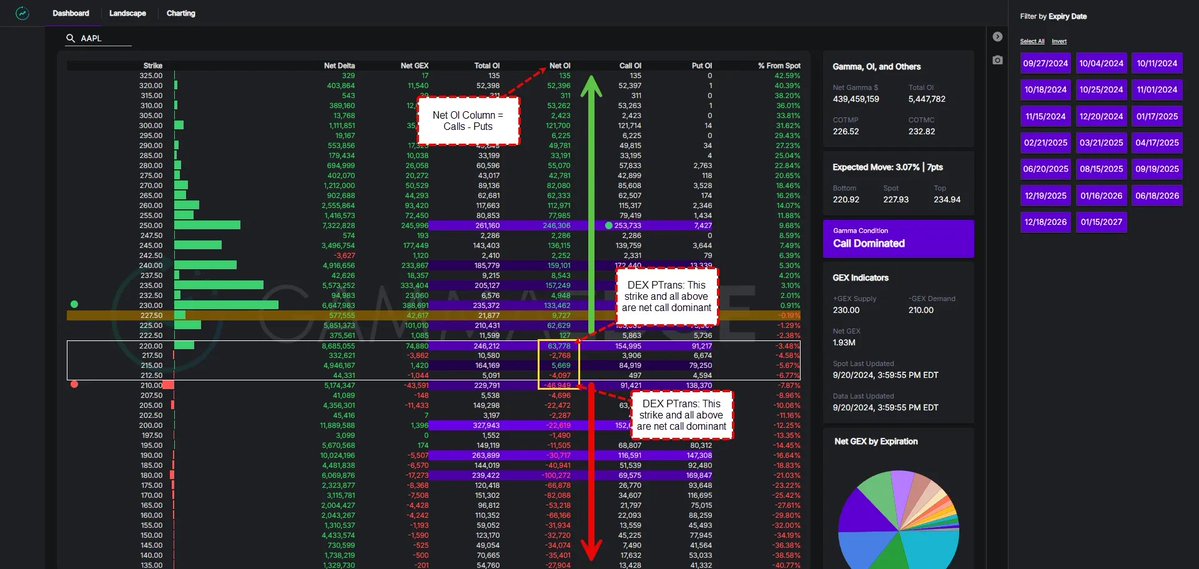
We measure and visualize this dominance using our Integrated Web App’s “Net OI” column (shown below).
This simple but powerful metric (Net OI) shows total calls minus total puts at each strike. Green numbers mean calls are in control; red means puts are in control.
Where the colors mix – the back-and-forth “chop zone” – is the Transition.
Now that we understand the transition zone and why it matters, let’s examine the specific levels that define its upper and lower bounds and how this impacts your SPX 0DTE trading strategy.
- PTrans: This is the strike in the structure where it and all other strikes above it are call-dominated (we have this annotated for you in the visual above), which creates an imbalance in the structure. This imbalance, favoring the calls, is what influences the natural progression of price higher. Our expectation is a continuation higher when PTrans breaks.
Another way to think about it is this: when the spot price finally breaks out of the transition zone, market maker hedging behavior changes dramatically (they have the chase price), often leading to price acceleration in the breakout direction. This is why these zones are so crucial for trade timing—they show us exactly where the market structure shifts from uncertainty to clear directional bias.
- NTrans: Vice versa of PTrans, where it and all strikes below it are put-dominated
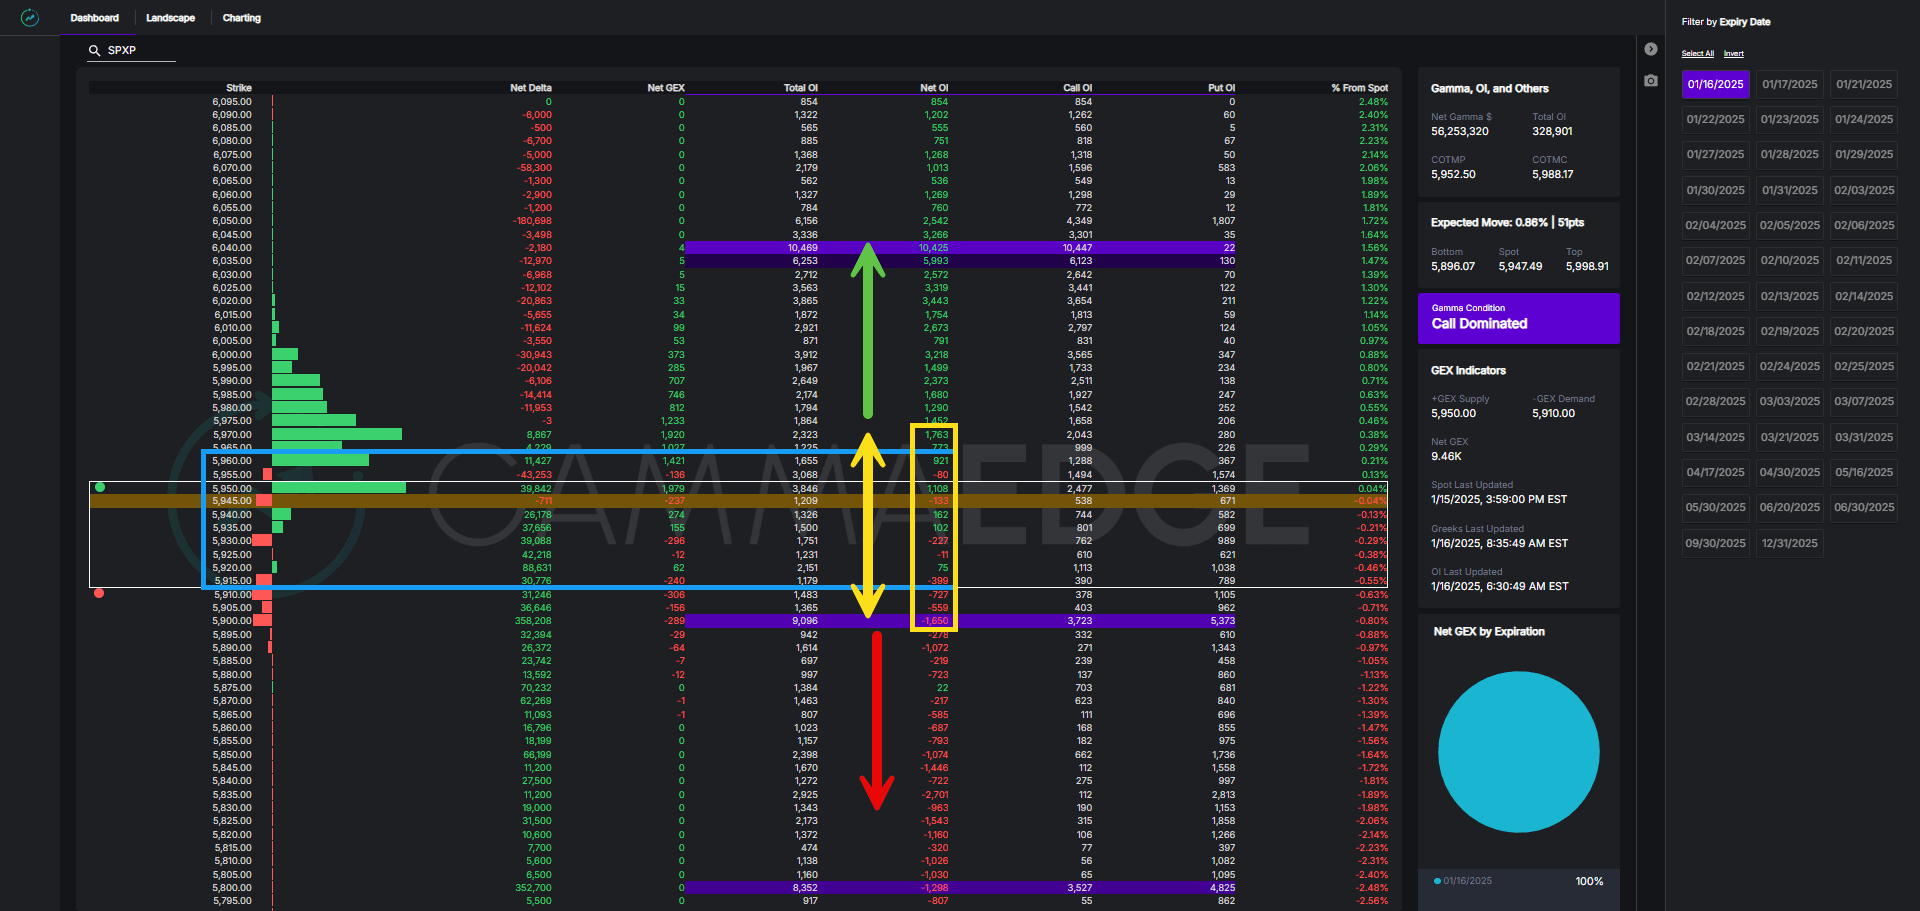
The example above defines the transition zone (TZ) as 212.50-220. Below is another example in which the DEX TZ (blue box) is defined as 5915-5960.
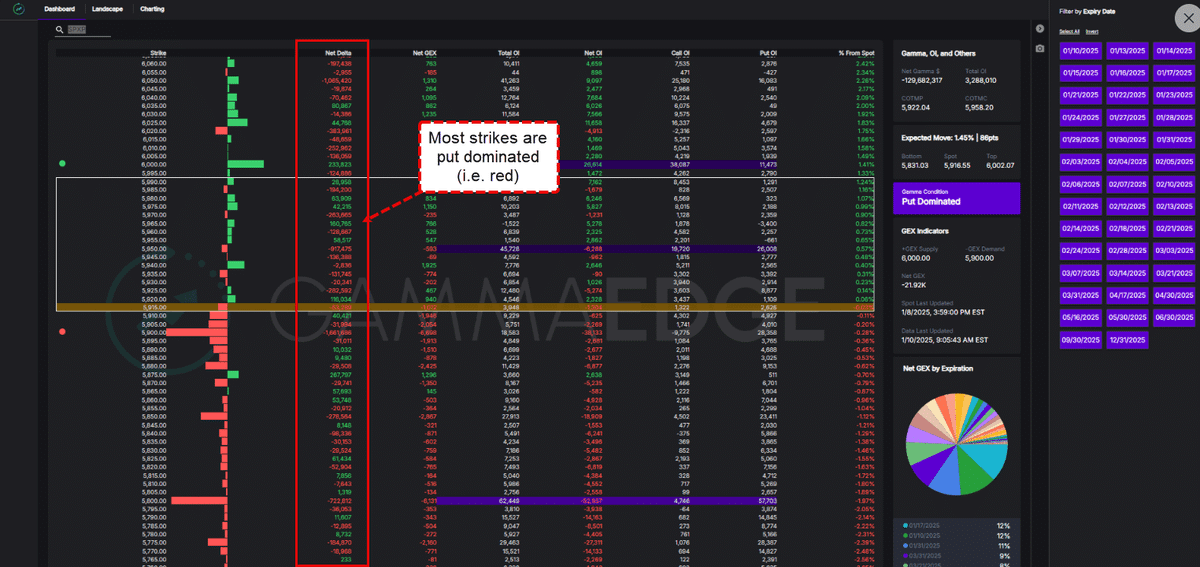
One important callout is the transition zone’s size, which provides essential information. A tight, well-defined zone (e.g., 5-points) suggests clear market conviction. In contrast, a wider zone (like below) often signals heightened volatility and warns traders to expect a broader choppy range.
To recap where we’ve been so far, you should now understand:
- What the DEX Transition Zone is and why it’s important
- Importance of tracking PTrans and NTrans
Now that we understand how to identify where control shifts in the market, the next logical question is:
Once a side takes control, where might they push price? This is where our SPX 0DTE trading target levels come in.
Upside & Downside Targets for Profitably Trading SPX 0DTE
Once the spot price breaks through one side of the TZ, we need to know where it might be headed next. This is where our key upside and downside targets come into play, which are based on, yes, the options structure. Specifically, they are informed by where options speculators have placed significant bets.
To the upside, there are two key levels:
- Positive GEX (+GEX): the strike where the largest call gamma exposure sits in the complex for a given expiration or set of expirations and
- Call Open Interest (COI) is the strike with the largest concentration of call open interest (independent of any Greek influence) for a given expiration or set of expirations.
To the downside, there are also two key levels, which are the opposite of the call versions just described above:
- Negative GEX (-GEX)
- Put Open Interest (POI)
Both sets of levels are important to track as they represent significant levels speculators are targeting, creating the structure that must be navigated.
As spot price moves above and below these levels, dealer exposure shifts rapidly.
It’s critical to track these levels intraday as they often become support and/or resistance points to price.
Why?
Using +GEX as an example, this is the strike with the most call gamma. Since we’re talking SPX 0DTE trading here, it’s likely the largest speculative position in the complex. Say the spot price is at $100, and +GEX is at $105 – this means the speculators have taken on $5 of OTM risk when they put the position on. Suppose the spot price moves up to $105. In that case, those speculators have now captured all $5 of that OTM risk, making their position quite profitable and a logical spot to monetize their position (aka lock in profits), which would introduce selling flows into the market.
Trading SPX 0DTE In The Real World
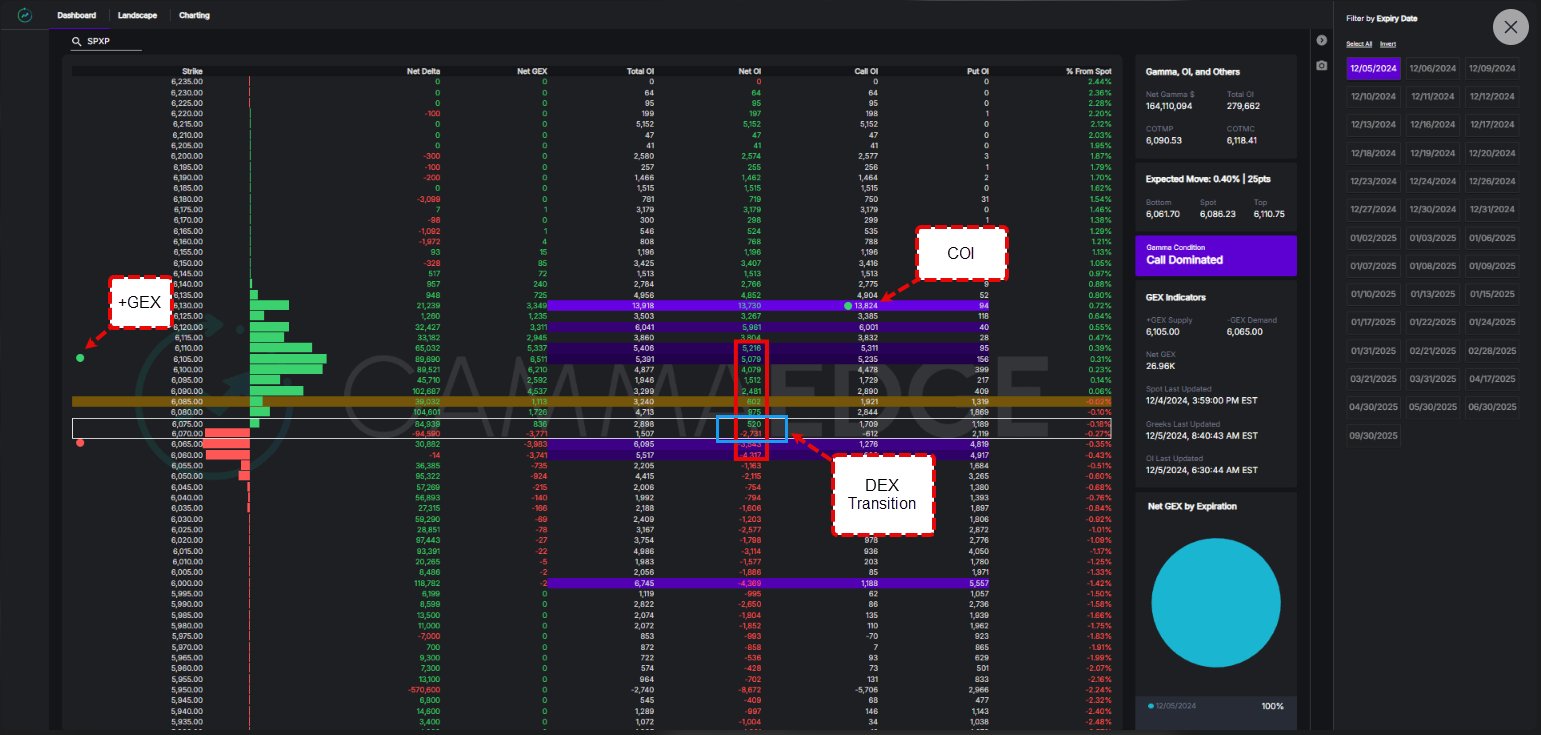
Back to our Web App. We help you also visualize these key target levels. In the visual below, we can see the following:
- Tight DEX Transition Zone from 6070-6075
- +GEX at 6015 and COI at 6130.
So the natural progression of price (from the bull’s point of view) would be: (i) break through PTrans at 6075, (ii) move to target 1 at +GEX (6105), and then onto (iii) target 2 at 6130.
Notice how each element of our framework – from transition zones to target levels – serves our core principle of simplification. Instead of tracking dozens of indicators, we focus on understanding the battle between calls and puts and where that battle will likely move price.
Putting It All Together
The beauty of this framework isn’t just its simplicity – it focuses your attention on what moves markets: the positioning of large options speculators. When you understand where the big money is placed and how those positions affect market maker hedging, you can trade with the market’s natural flow instead of against it.
To summarize our single-strategy framework for trading SPX 0DTE:
- Identify the DEX Transition Zone
- Note your directional targets (+GEX/COI above, -GEX/POI below)
- Wait for clean breaks of PTrans or NTrans
- Trade with the structural momentum
That’s it. No more drowning in complexity or analysis paralysis. It’s just clean, structure-based trading.
Want to learn more?
If you’re ready to dive deeper into this framework, including how we use intraday volume analysis to confirm these moves, check out our free educational course: The GammaEdge Framework.
Remember: In trading, less is often more. Focus on understanding market structure and positioning; you’ll be amazed at how much clearer your trading becomes.
What aspects of market structure analysis do you find most challenging? Let me know in the comments below.
Additional Resources
- In the YouTube video below, we walk through our entire premarket SPX 0DTE trading routine. Yes, it’s long (~40 minutes) but if you’re serious about improving your 0DTE trading, then you’ll make it a priority to watch.
Frequently Asked Questions when Trading SPX 0DTE
What is SPX 0DTE?
SPX 0DTE refers to S&P 500 index options that expire on the same day they are traded. These options are popular among day traders due to their high volatility and potential for significant returns.
Why is the DEX Transition Zone important for trading SPX 0DTE?
The DEX Transition Zone represents the area where control shifts between call and put speculators. By identifying this zone and its boundaries (PTrans and NTrans), traders can better assess which side (bulls or bears) has the upper hand in influencing spot price.
How can I learn more about trading SPX 0DTE?
To learn more about trading SPX 0DTE and the key concepts discussed in this post, check out The GammaEdge Framework, a free 3-module course designed to help you leverage the options market for more profitable trading.
By the way, this blog was created from a previous X thread that we published here.
We train traders to simplify the options markets with our industry leading data, tools, and education to achieve profitability.
Services
Quick Links
Get In Touch
email: contactus@gammaedge.us