The Cumulative Tick – What it is & Why It Matters
What is the Cumulative Tick?
The GammaEdge Team uses tick information to track what is happening “right now” in the market. We believe this has advantages because the CT is not delayed like many other indicators, some of which may be based on the application of moving averages (MAs). While we use various MAs of the CT to understand where sentiment was in the past, we only use MAs as reference points. Of all the possible ways to use the CT, we focus on the slope of the real-time CT line, as this is visual and gives us a real-time view of trader sentiment and urgency.
Table of Contents
Background on the Cumulative Tick
Before we give examples of why we think this can be an edge in your trading, let’s recap the tick, what it is, and one way to interpret the information.
Tick is transactional — it triggers with each stock or equity transaction. The size (volume) of the trade does not matter — if we buy 10,000 shares of the stock or one share of stock, if the price changes upward as a result of the purchase, both transactions will result in a single “uptick.”
The converse of this is true too. If we sell 10,000 shares or even one share of the stock, if the price drops due to the sale, both will result in a “downtick.”
We can keep track — a scorecard of sorts — of upticks and downticks. If we track these over a short period, say one minute or less (“bar interval”), we can add the total upticks and subtract the downticks over that bar interval and come up with a net balance of buying and selling activity that directly represents the sentiment of market participants over that short time frame.
A positive bar-interval tick indicates more buying activity than selling, while a negative bar-interval tick indicates the opposite over that concise time frame.
We take this one step further (and we do): we create a Cumulative Tick, adding the previous cumulative results to the current bar results. We do this for every bar of the trading session, creating a direct picture of market sentiment for the period being displayed. This CT line moves up over time if there is net buying and drops lower if there is net selling.
Here’s an example:
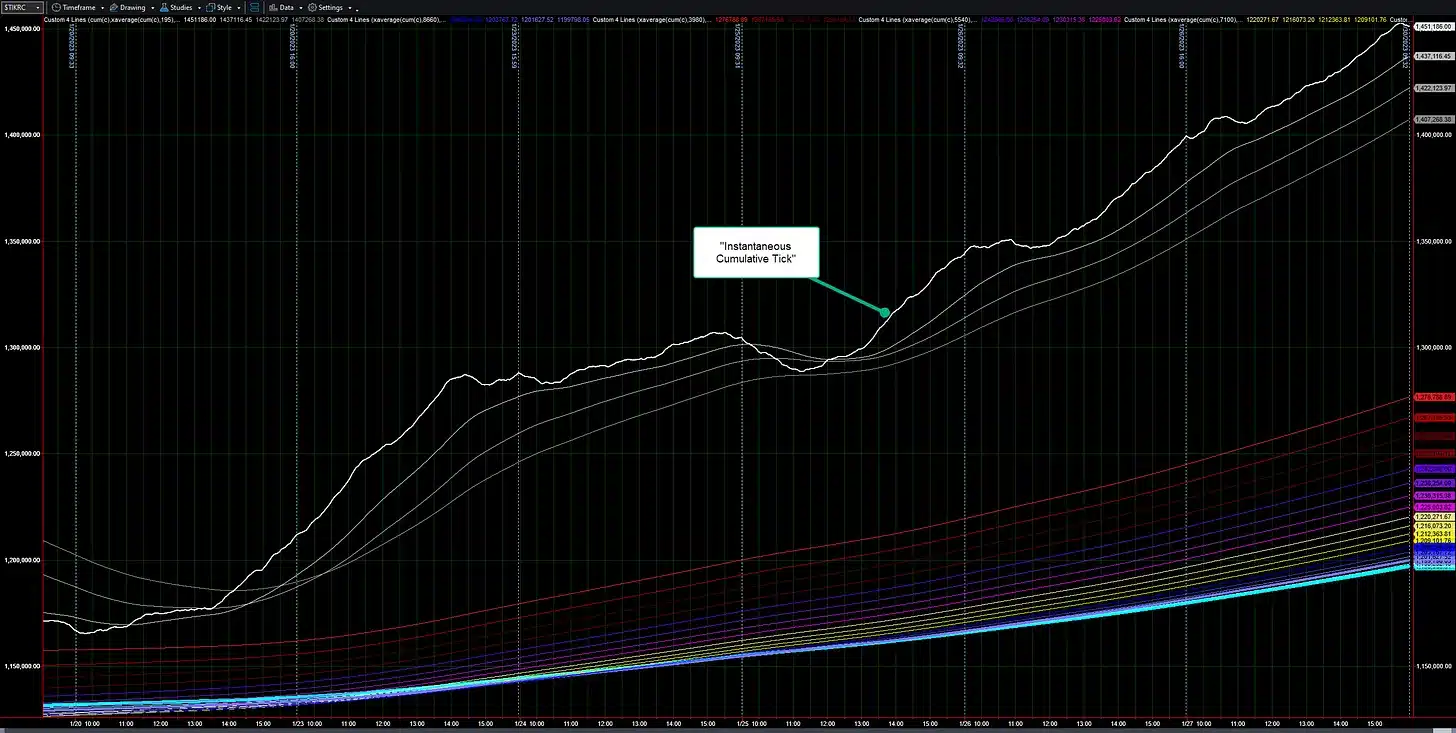
You can see a bolded line in that figure — that bolded line is the CT, and the uptrending lower-left, upper-right (“LLUR”) directionality tells us that for the period displayed, we’ve been in an uptrend. We often refer to that bolded line as the “Instantaneous Cumulative Tick.” LLUR patterns with the CT are associated with bullishness within the market. Participants are buying.
Interpreting the Cumulative Tick
The GammaEdge Team combines the instantaneous CT with various moving averages, and this creates a visual to show how the CT is behaving relative to a short-term perspective (the thinner, white moving averages in the figure) as well as a longer time frame (the colorful moving averages which we call the “ribbon”).
When used together, the CT and shorter/longer time frames give us a good visual of present market sentiment relative to multiple time frames. This can inform various trading styles (0DTE, swing, or position trading).
We believe there is a tremendous amount of information contained in our visual. Without teasing/torturing the data, here are some of the possibilities:
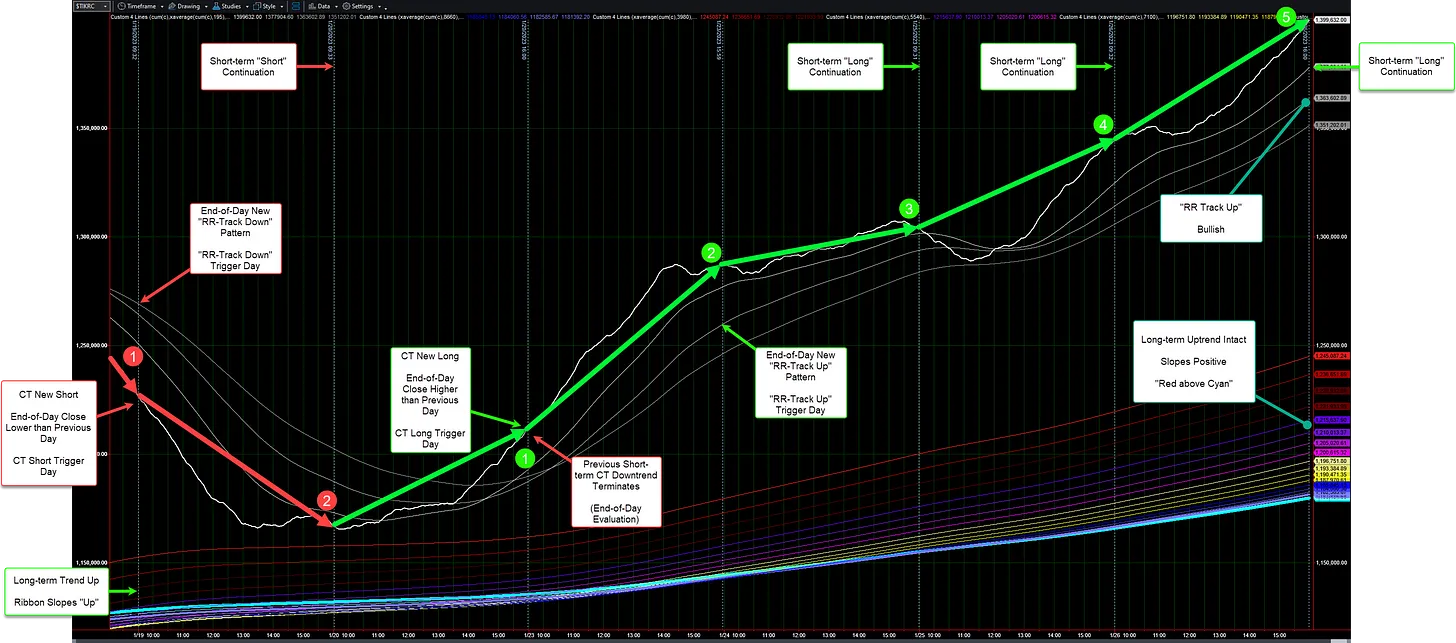
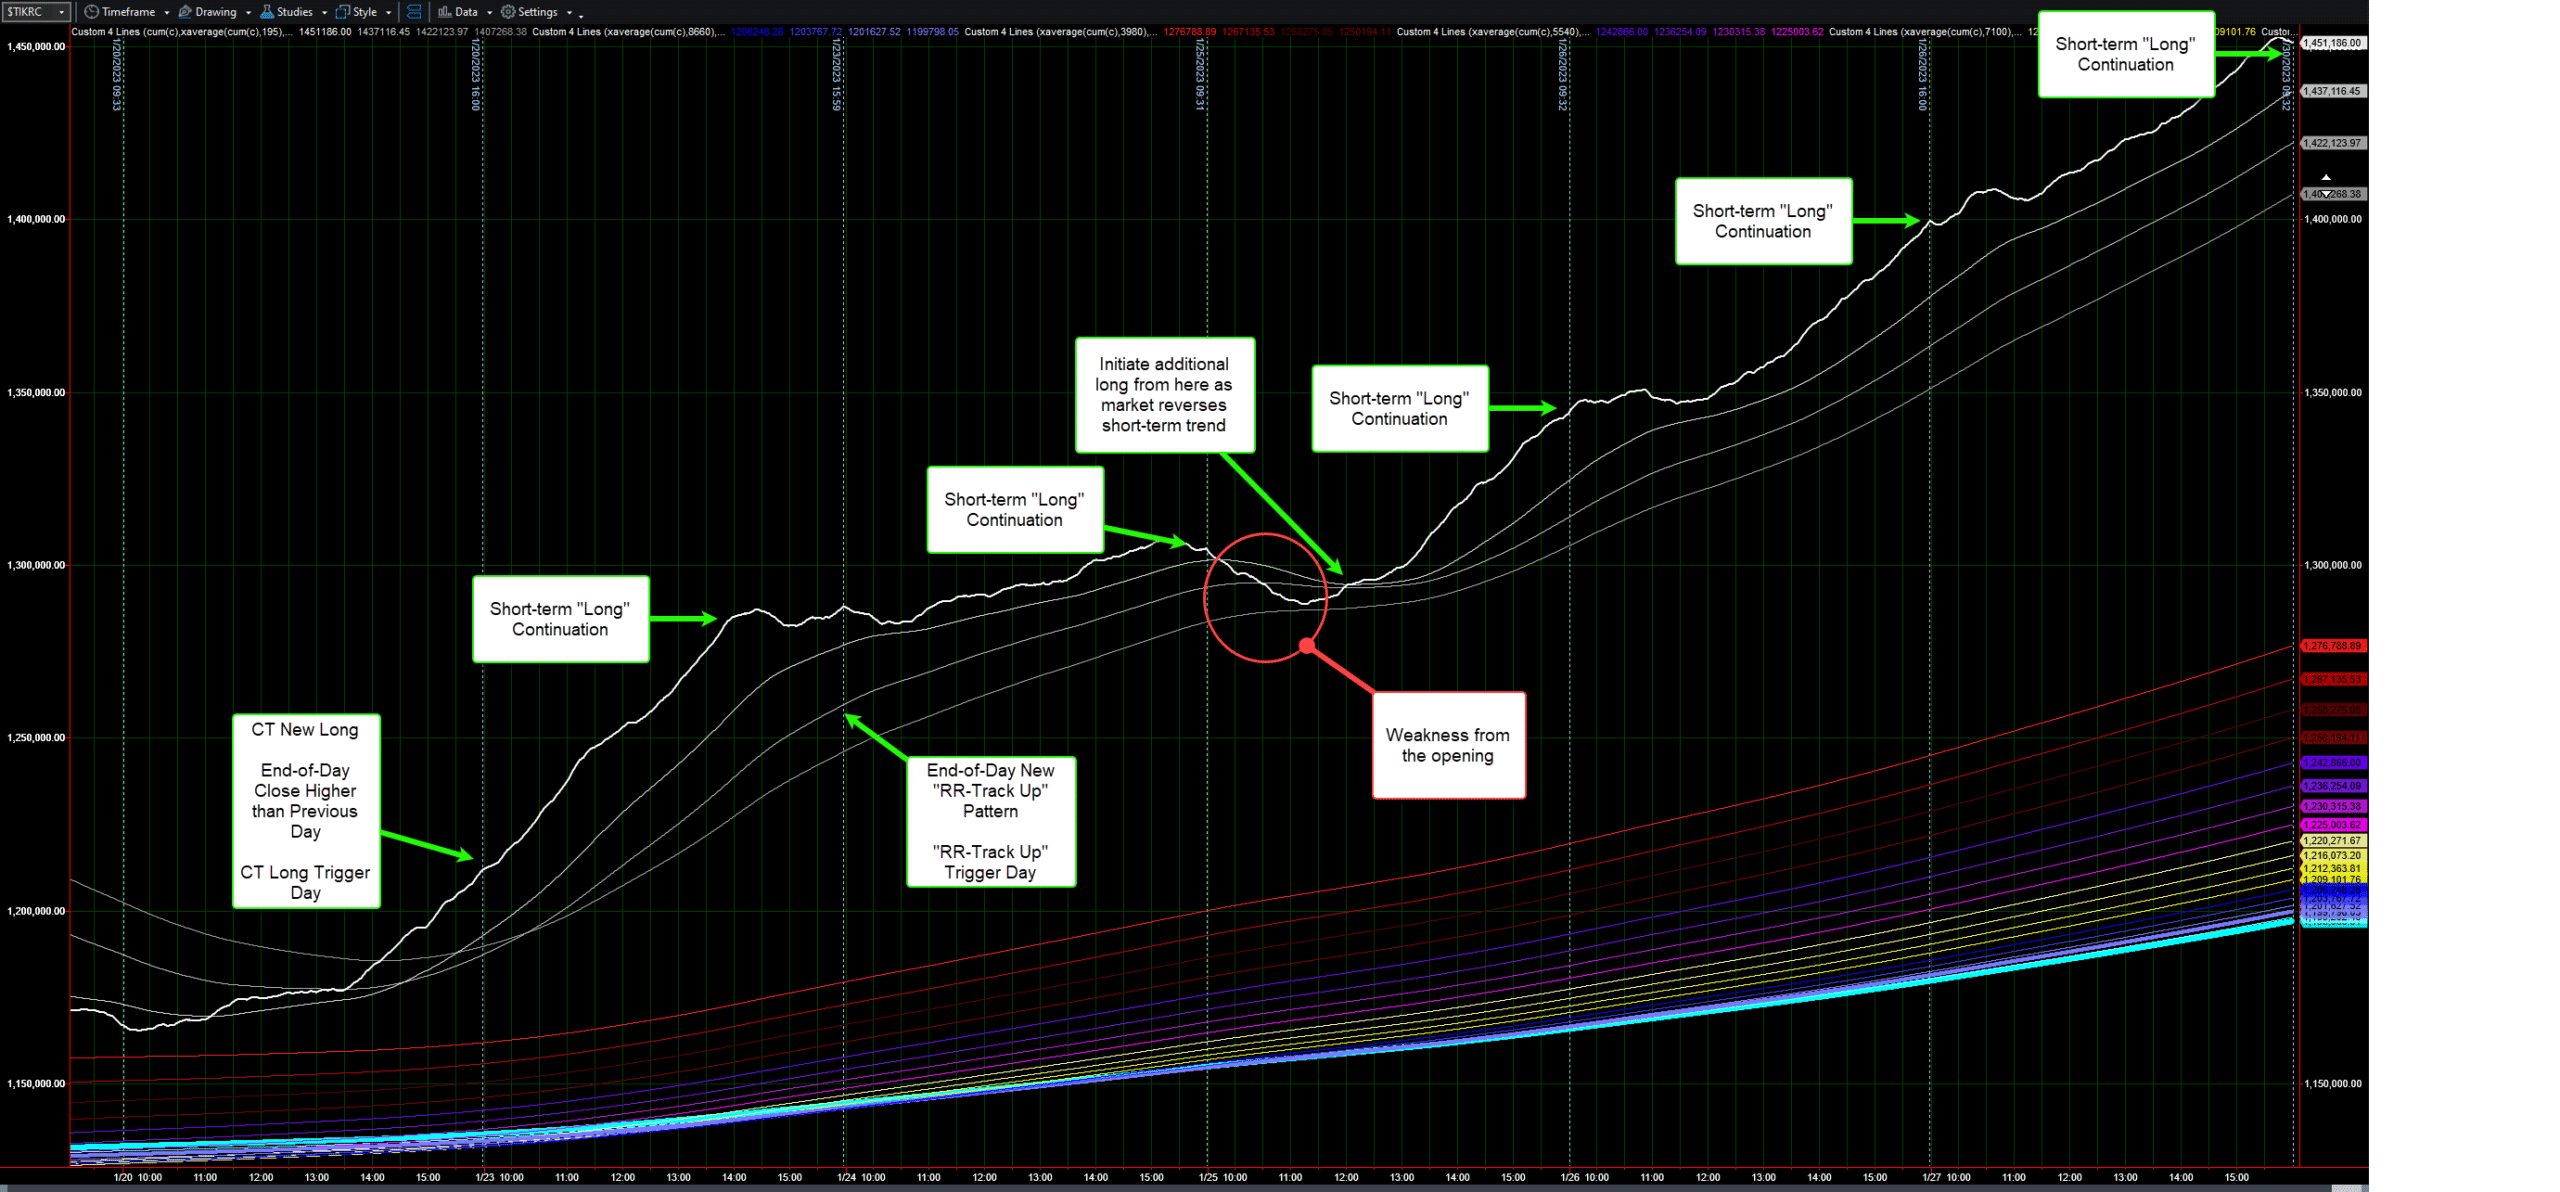
This figure shows various transformations of the CT signal across different time frames. The circled numbers in red and green refer to the CT’s end-of-day (EOD) evaluation and count the days that the CT is consecutively higher or lower.
Callouts indicate new “trigger” days for various CT signals and continuation days where the current signal remains intact.
We urge you to review this figure, starting on the left and reading to the right side, to understand how a multiple-day interpretation is created.
Many of the GammaEdge members have become experts at being able to read the CT and apply it to their decision processes. The GammaEdge Team regularly posts screenshots at key turning areas. Additionally, GammaEdge members have developed and actively support TradeStation and Think or Swim (TOS) studies, available within our Discord, that enable you to view the CT in real time.
Have questions? You can join us, risk-free for 14 days, by subscribing to our Discord through our website here and clicking our signup page.
How can GammaEdge’s Cumulative Tick market model keep me on the right side of the trade?
A: Trade with the trend.
While trading with the trend seems like a less-than-insightful response, the reality is that it is a powerful statement. We have ample evidence — in our own application of the CT and in conducting extensive, rigorous backtesting of various CT setups. We’ll provide a few basic examples here for your consideration.
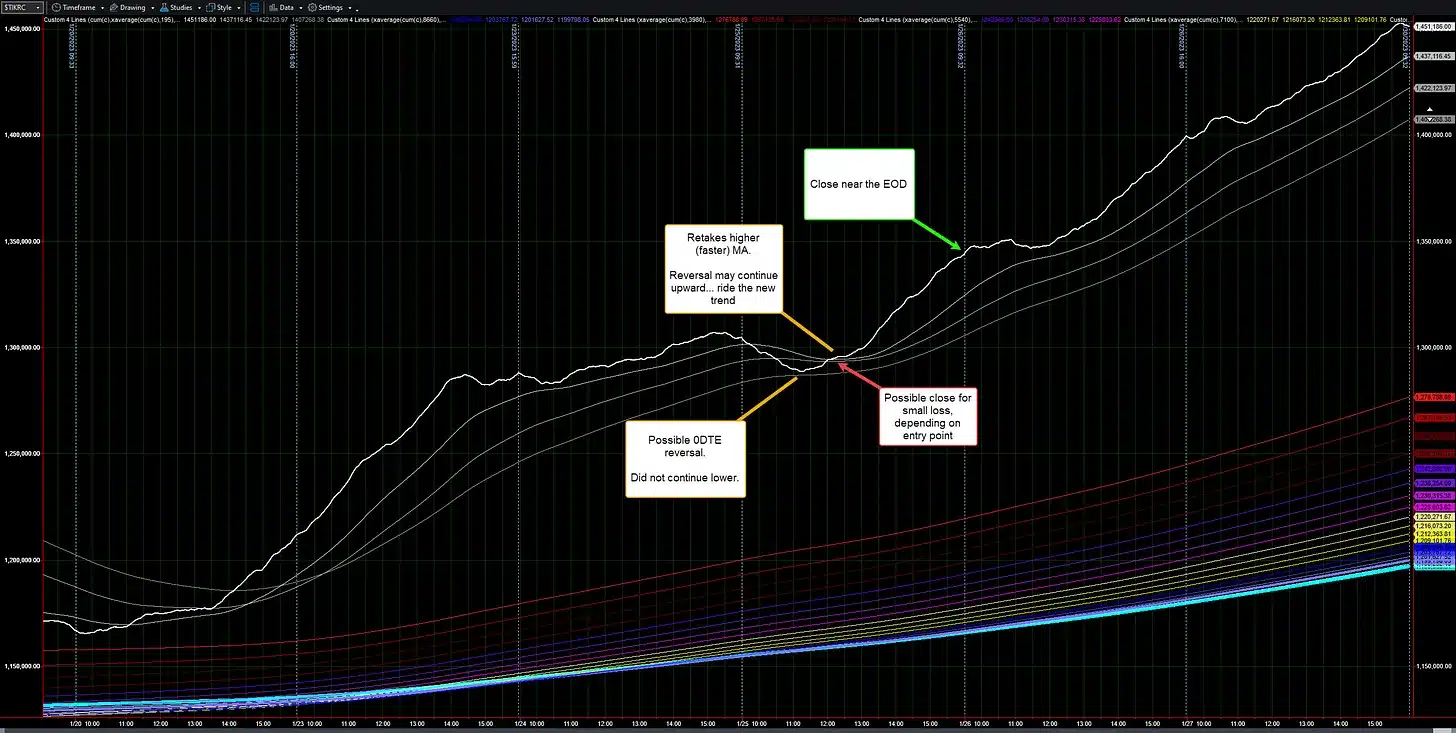
Applicability to 0DTE Traders
Timeframe matters, of course. 0DTE traders who like to only trade intraday watch the instantaneous CT slope: as it turns from one direction to another, they follow the trend on a short-term, intra-day basis. Many report getting out of the trade or reversing their position when the CT intraday trend begins to falter or reverse.
Here’s an example from this past week:
Applicability to Swing Traders
Because every swing position begins as an intraday trade, we also see swing traders enter on valid intraday signals. If that signal persists, the swing trader can carry the position longer than the day.
Here is an example that carries from the previous 0DTE figure:
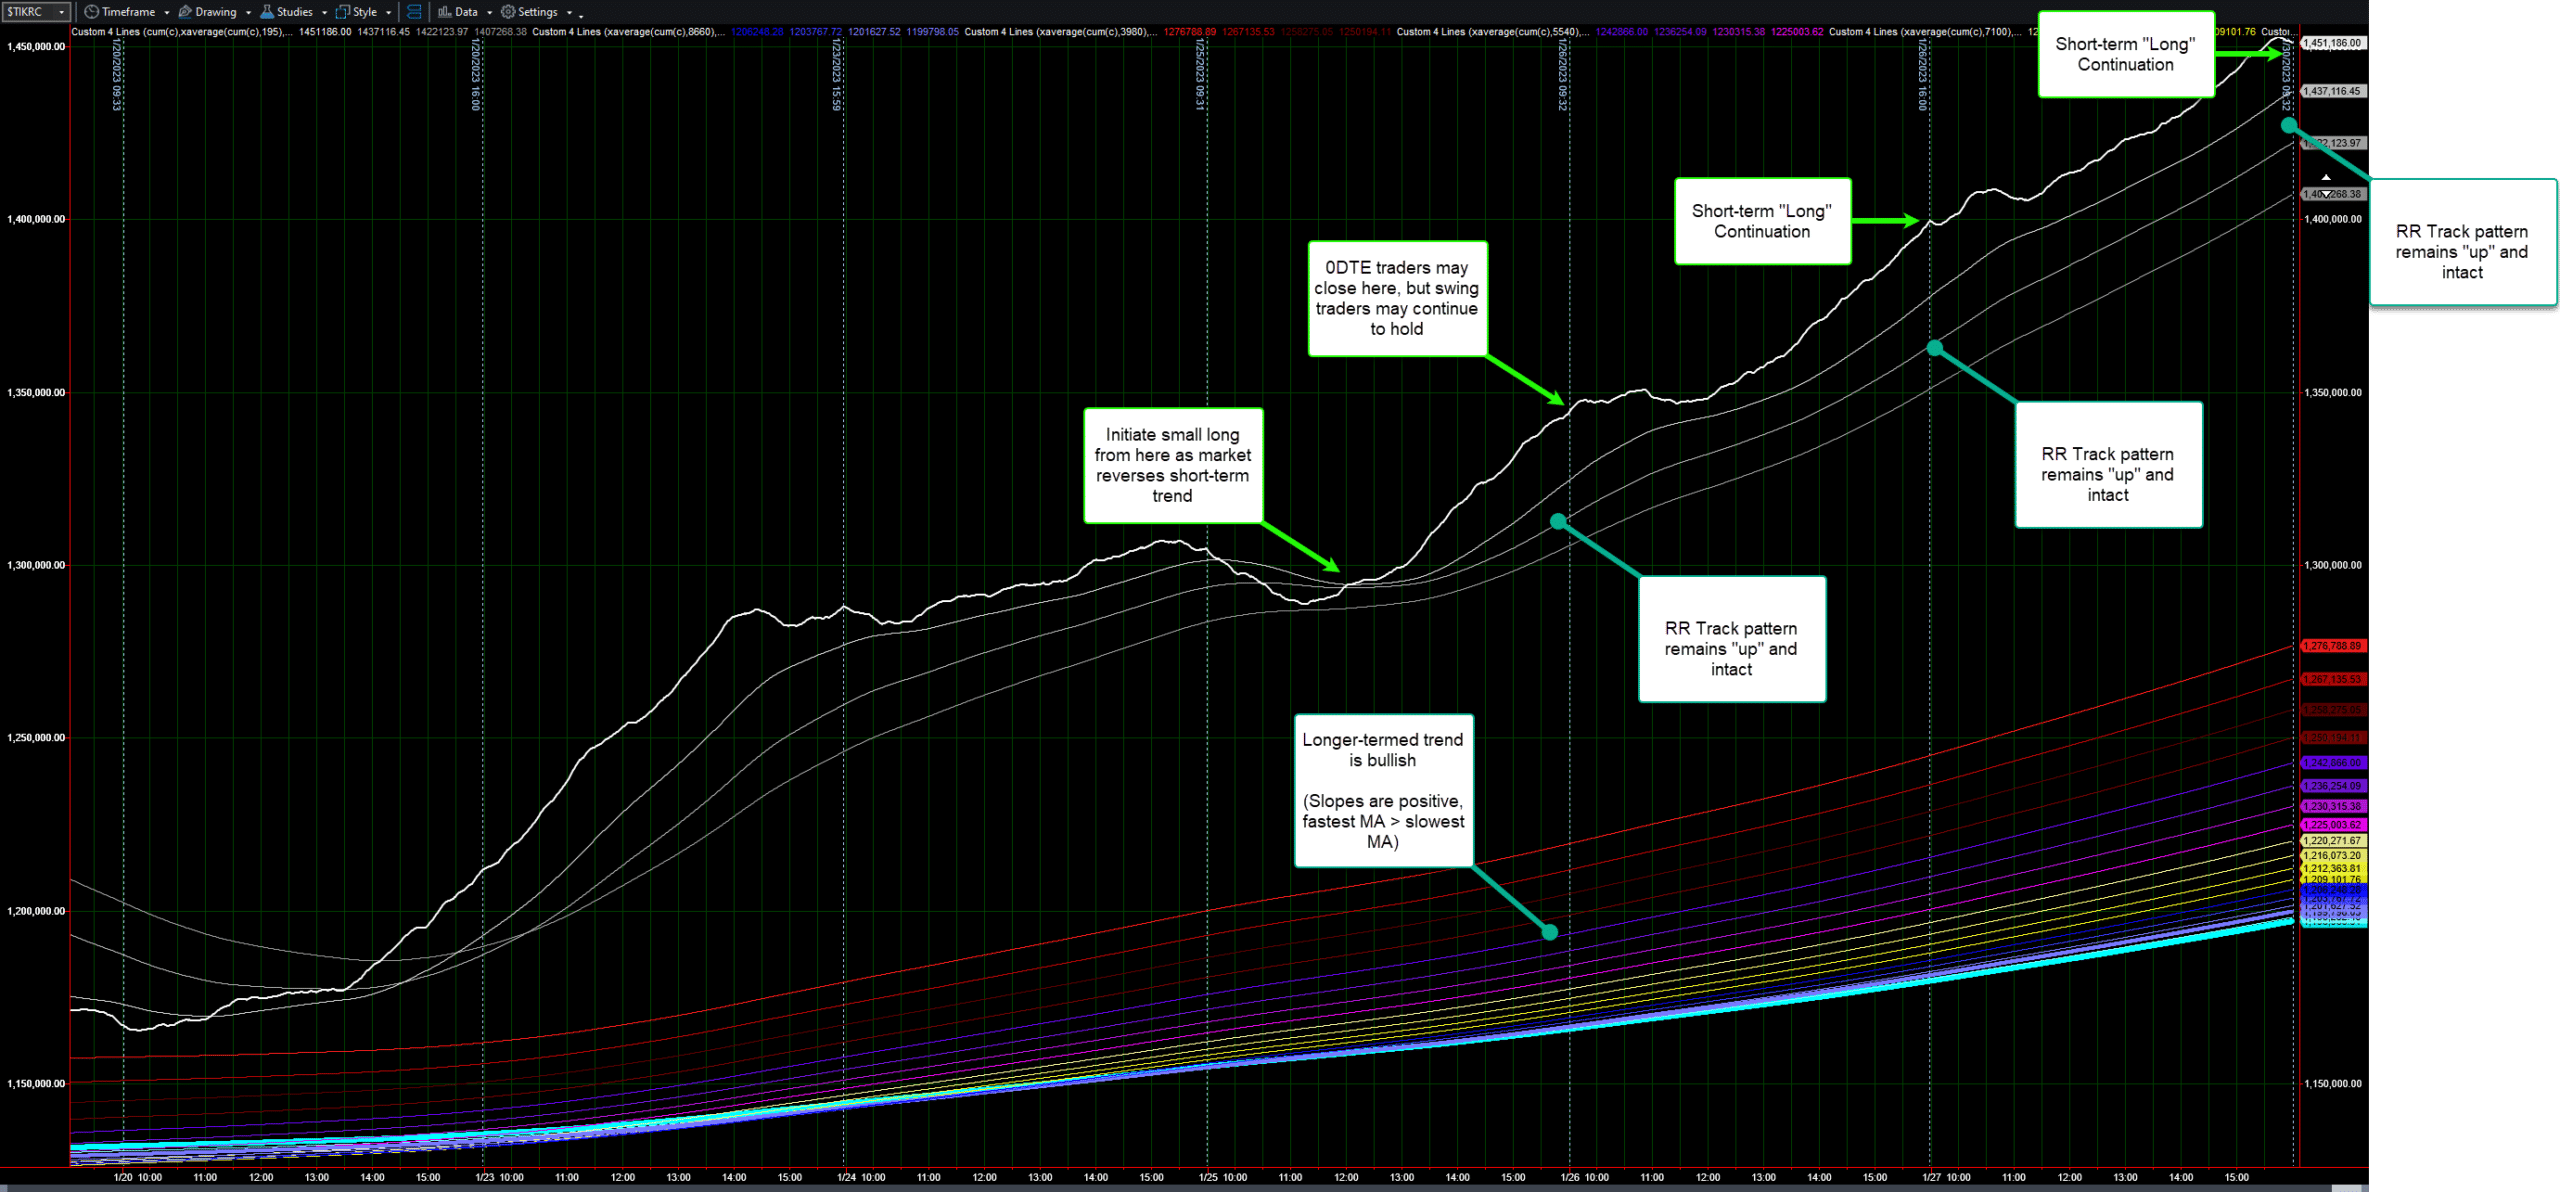
This is the same data as the previous figure, but you can see the transition from a 0DTE mindset to a multi-day swing-trading mindset. After entering the position and watching the 0DTE action, swing traders shift their time horizon: what was an intraday start becomes a multiple-day hold, and depending on price action and CT, some may choose to hold multiple days or weeks as long as the trend remains intact.
In this case, the selective entry that was ideal for 0DTE could also be an ideal entry for swing traders, and as long as the trend continues, there is no major rationale to exit the markets.
Applicability to Progressive Exposure
Pullbacks on the CT, which are generally correlated with pullbacks in price, also give the opportunity to add to positions, creating “progressive exposure” to the trend and enabling sound risk management.
The previous 0DTE figure is a prime example of this: the previous entry and swing continuation was met with short-term weakness after a few days of advance. This could have been a perfect opportunity to add to existing long positions.
Here’s that same data showing how the continuation of the trend, as indicated by the CT, could have given you the confidence to add to the trade on a short-term pullback, allowing you to increase your exposure and potentially, your profits:
Conclusion
These various outcomes, as well as those that are related to the short side of the market, are all enabled if you know how to read the CT.
This discussion by the GammaEdge Team is scratching the surface of the power of the CT. We have presented detailed backtesting results within our Discord for both the long side as well as the short side of the CT and continually apply this information to aid our members in understanding the market climate and what is unfolding in real-time.
Applying the GammaEdge CT with various GammaEdge scans on our favorite liquidity stocks and ETFs enables our members to “stack the edges” and increase the probabilities of selecting optimum trades.
Have questions? Want to read more on robust backtesting of the CT using the power of EdgeRater? Want to see the CT in real-time and learn how to apply it to your style of trading or investing? All new members can join us, risk-free for 14 days, by subscribing to our Discord through our website here and clicking our signup page.
We hope that you find this detail useful. Please do not hesitate to ask questions should they arise!